Lift Analysis
Open any lift to see the result, where it ranks against every other, and what it all means in plain sentences.
A single number never tells the whole story. Lift Analysis opens beside the table when you click a lift, and shows what the number is, how sure it is, and how it compares.
Open it
- In Lift, click any lift in the table.
- Lift Analysis opens in the right panel. The row you picked is highlighted.
- Use ‹ › in the toolbar to step to the row before or after, on the same measure. The panel follows.
You can also open it from anywhere: Tools > Lift Analysis holds a card for every video the tests measured.
Analytics
The first tab is the numbers, in three sections.
Result
The line at the top runs from 0 to 100: the arrow starts at the control group's level and moves by the lift. Below it, the treatment group beside the control group:
- Mean: each group's level on the measure.
- Sample size: how many people were in each group.
- Impact: the lift, in points, and four bars for its strength. More bars lit means less chance it's noise.
- Confidence interval: the margin, a 90% interval. A margin that crosses zero means the test couldn't tell the effect from none.
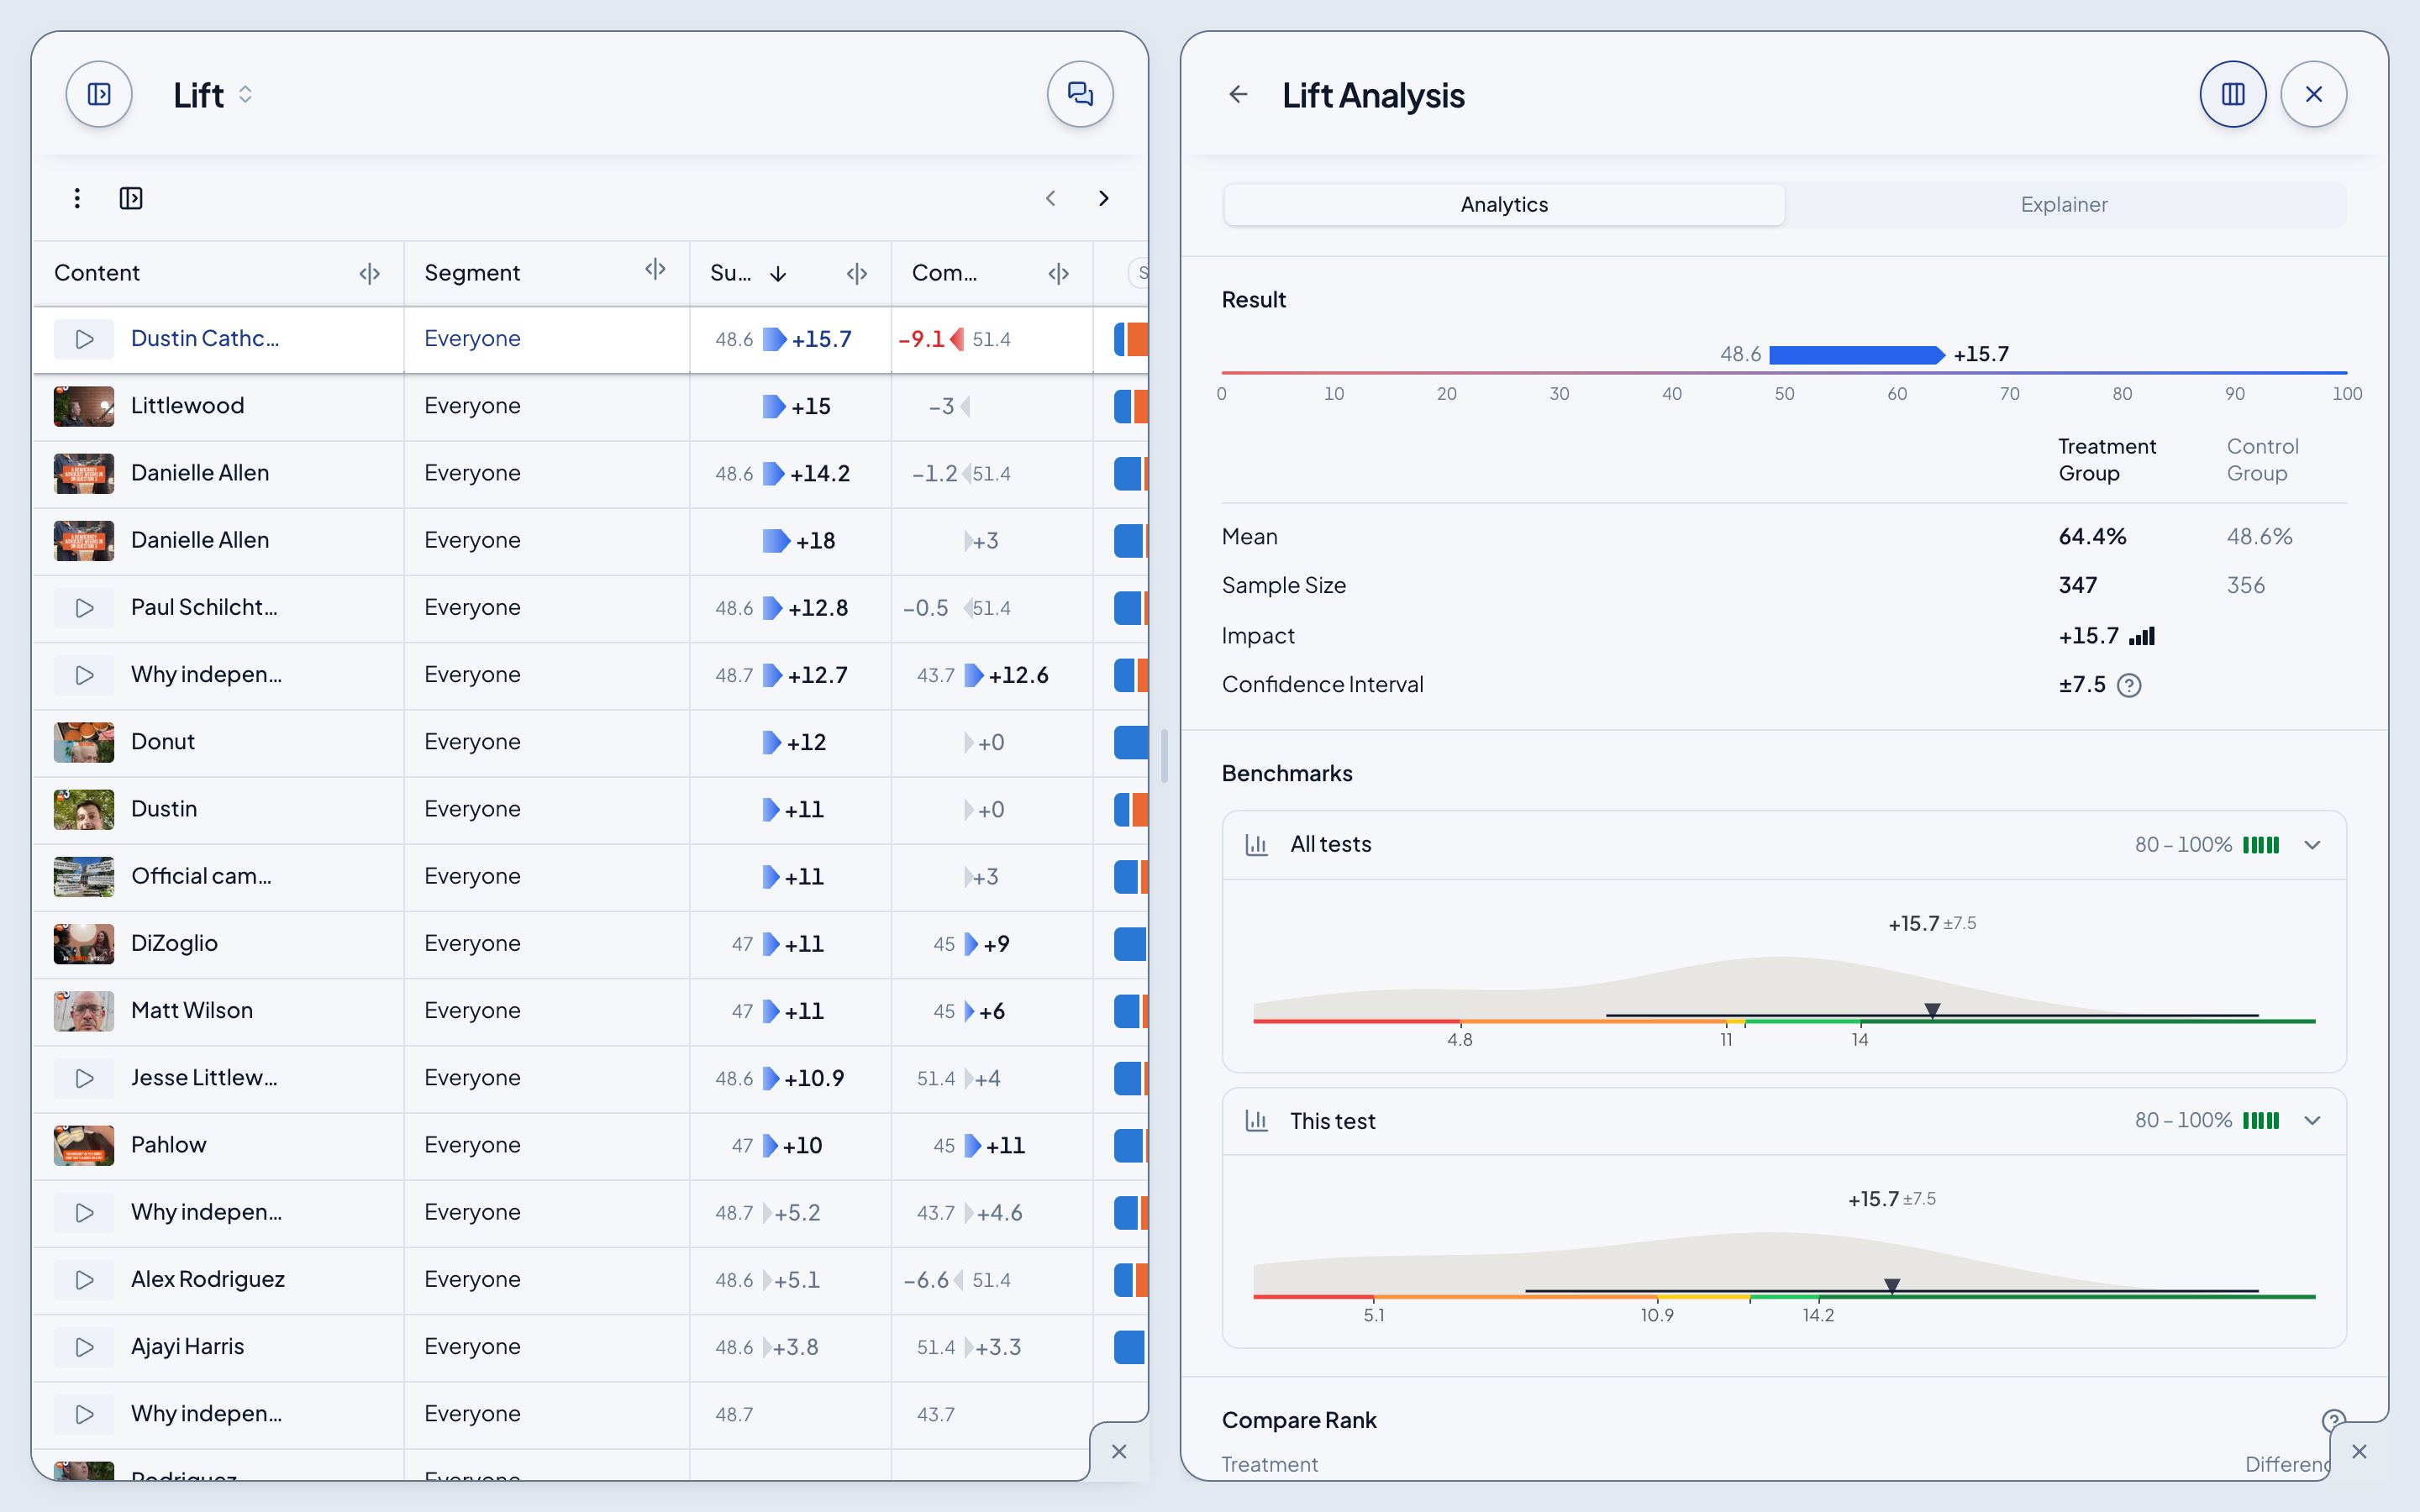
Benchmarks
Each benchmark places the lift among others on the same measure and segment: All tests, the folder's own when it differs, and This test. The curve shows how those lifts spread, with this one marked. The bars on the right say which fifth it falls in, from the bottom 0 to 20% up to the top 80 to 100%.
Click a benchmark to open its details: the impact, the benchmark's median, and the set it's drawn from.
Compare Rank
Every video in the same test, ranked by impact on this measure. Difference is each one's lift less this one's.
Explainer
The second tab says everything Analytics shows, in sentences. Each section has a headline that sums it up, and its source sits at the foot: where and when it was fielded, the producer and length, and the wave's pairings.
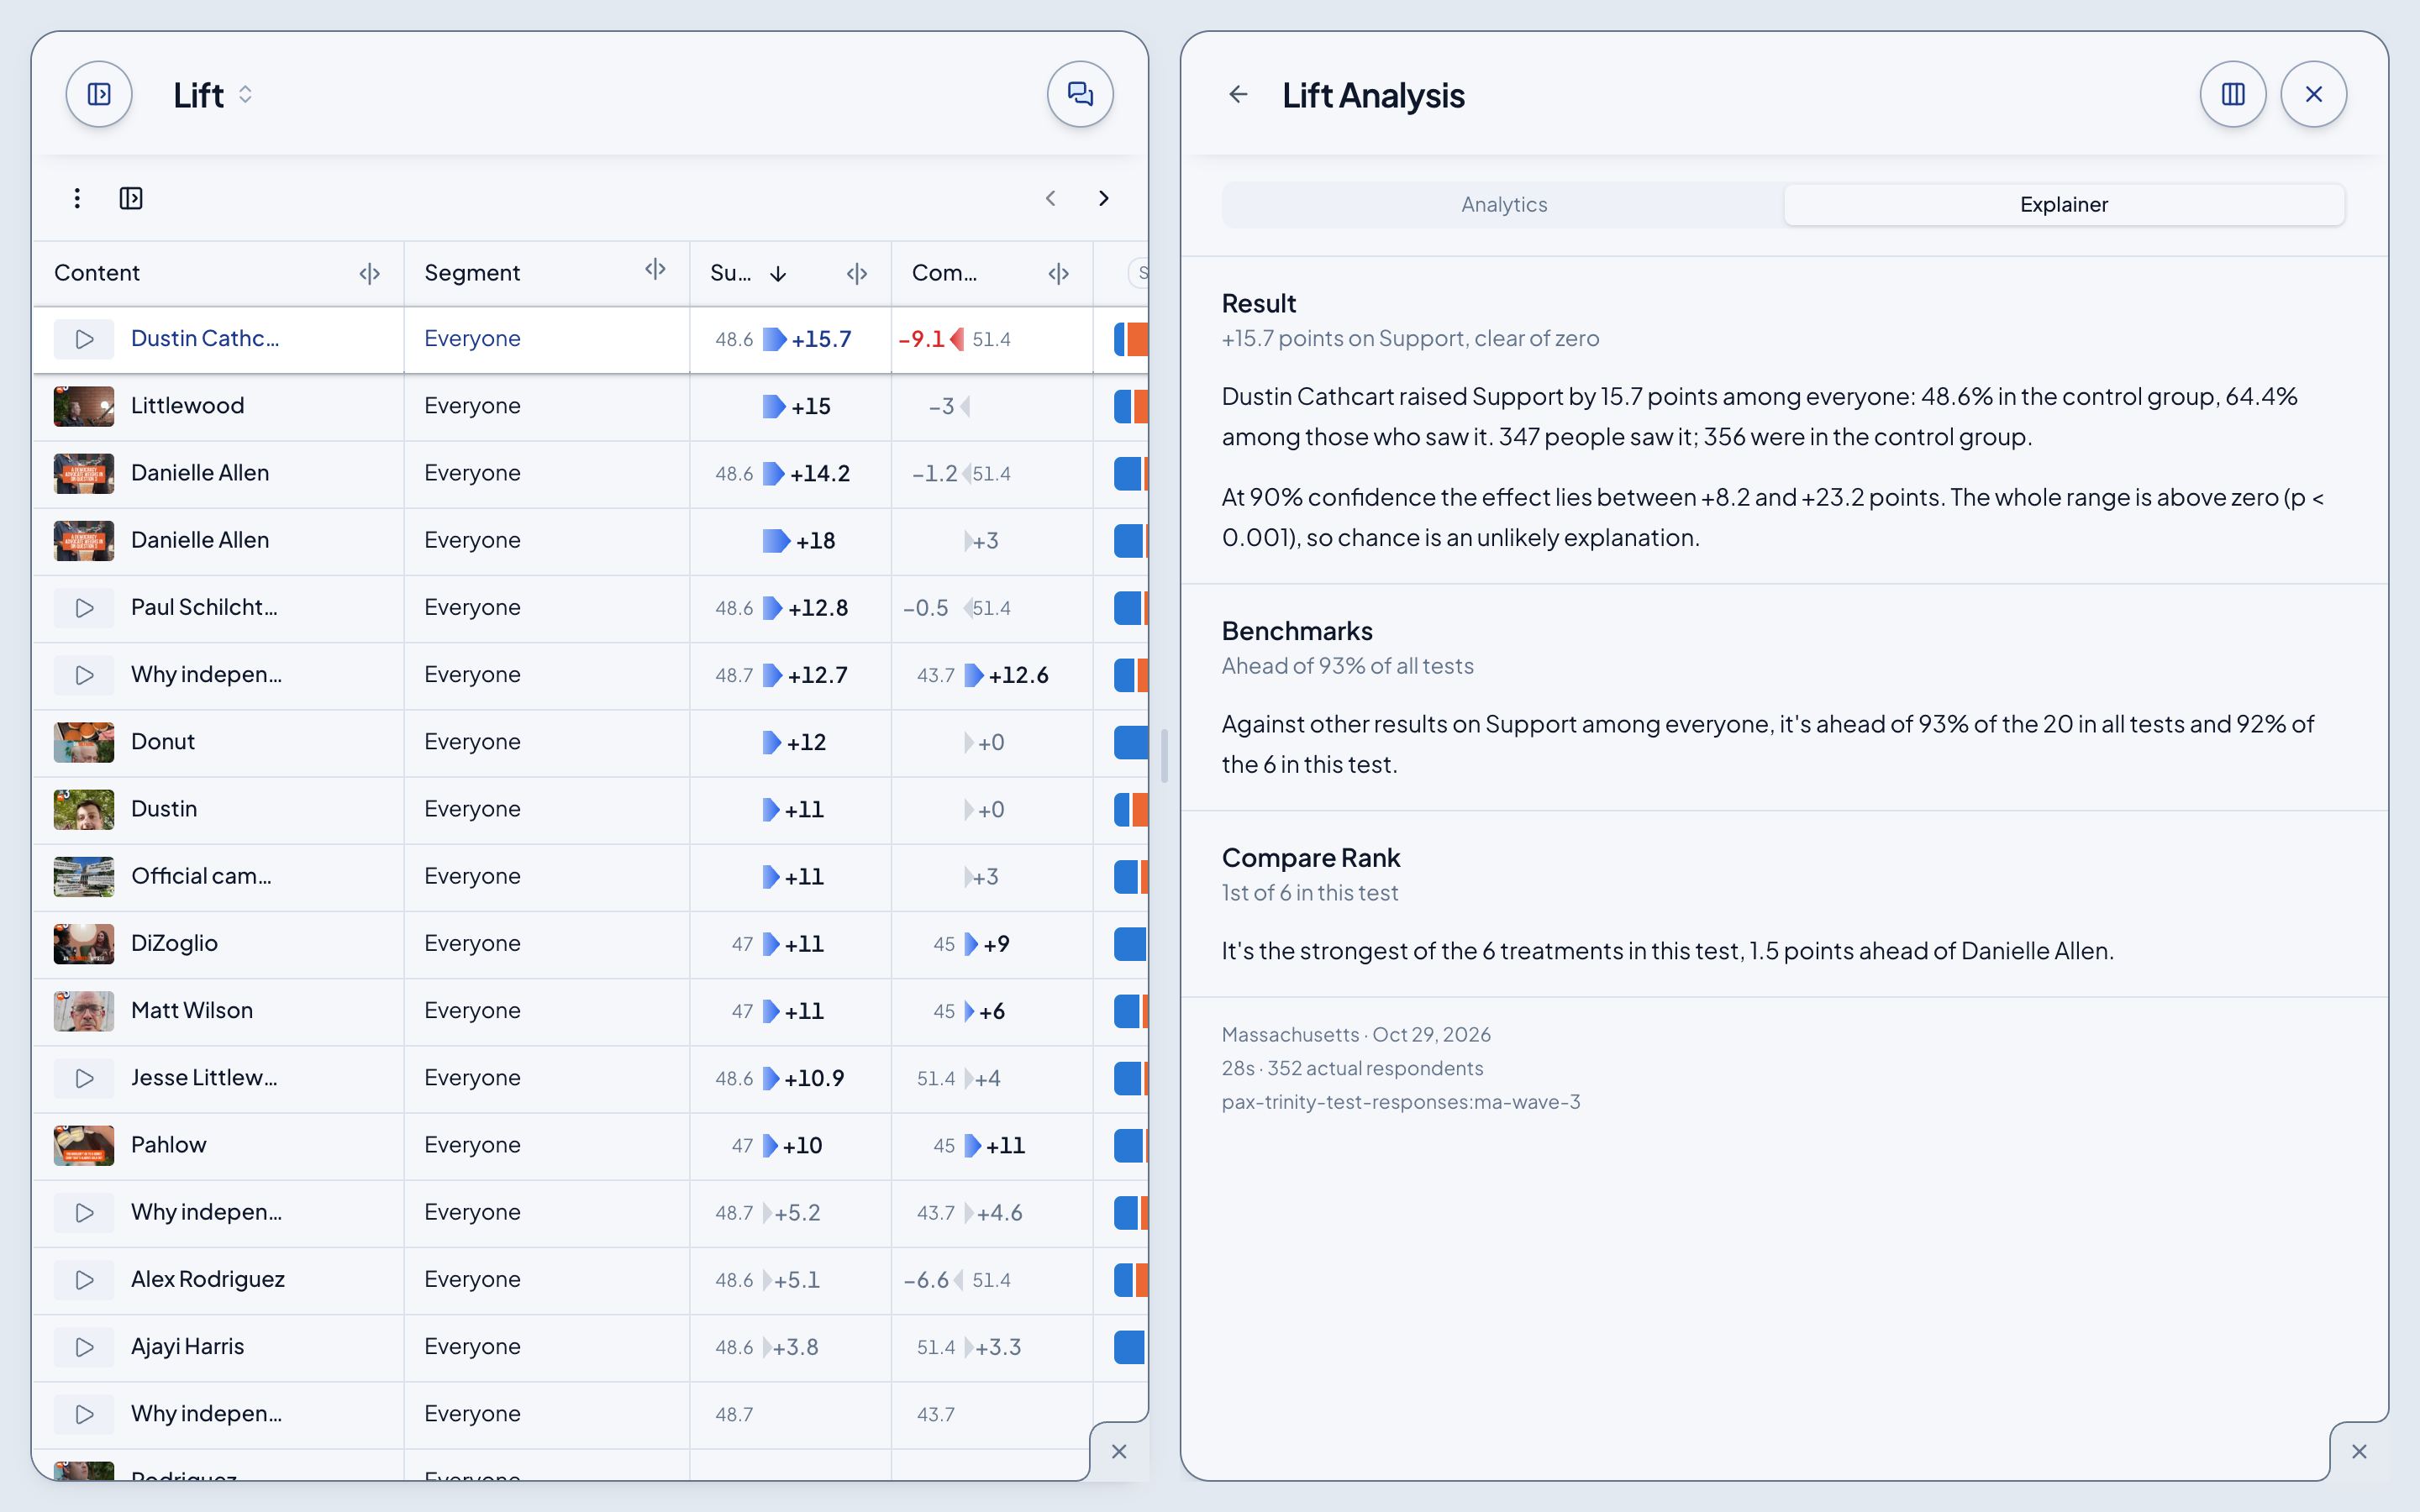
Go back
The arrow before Lift Analysis in the panel's header climbs to Tools' Lift Analysis cards, so you can open another.