Lift: see what moved people
Every tested video's effect, side by side, so you can tell a strong result from an ordinary one before you scale it.
A lift means little until you know what ads usually do. Lift sets every result on file side by side, so a strong result stands out from an ordinary one at a glance.
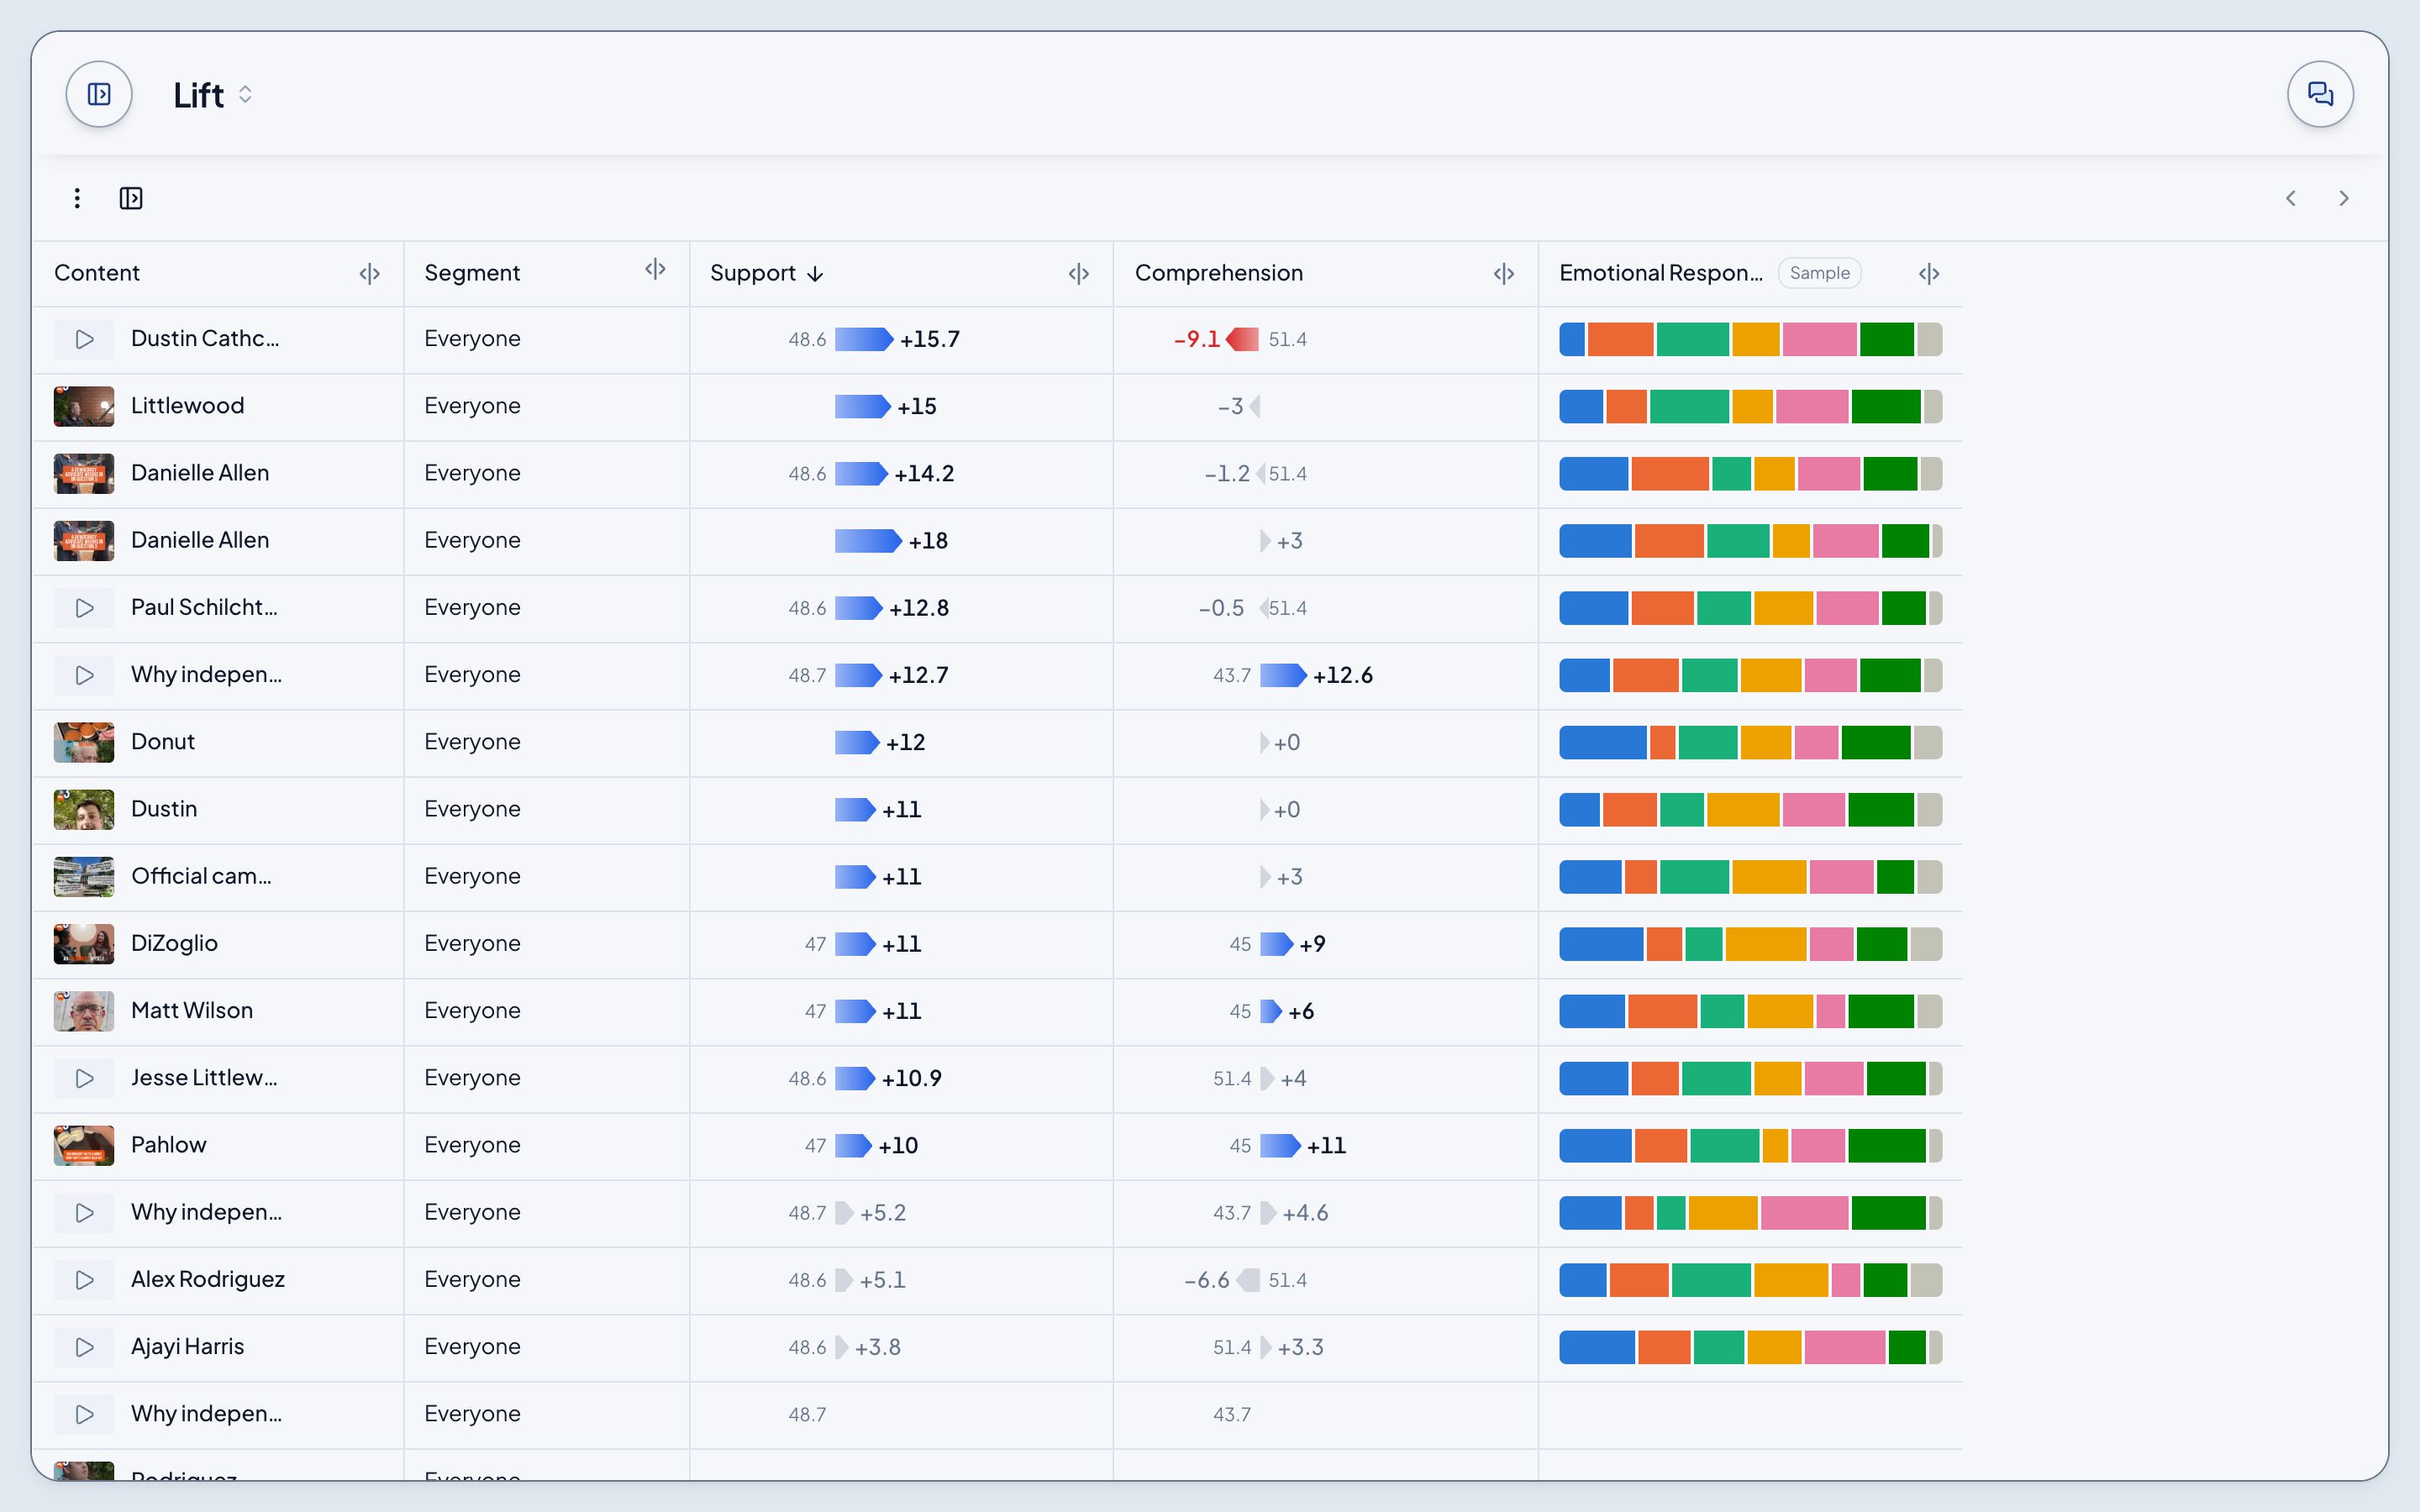
Read the table
Each row is a video, and each column one measure: Support, Comprehension and Emotional Response for the tests, favorability and vote choice for the Archive.
- The small number at the left of a cell is the placebo group's level.
- The bar runs from that level by the lift, in percentage points. Its tip points the way people moved, and the number past the tip is the lift.
- A lift drawn in grey didn't clear its test: the test couldn't tell it apart from no effect.
- Emotional Response shows the share of people naming each feeling. No test has asked it yet, so it's marked Sample.
Breakdowns
Below Everyone, each video's lift is broken down by age, education, gender, party and more. Each breakdown is a band across the table: hover it to see its arrow, and click it to fold its rows away. Click again to bring them back.
Sort and size the columns
- Click a column's name to sort by it. Click again to reverse.
- Drag the control at the right of a column's name to make it wider or narrower.
- Hover a column's name to see its info circle, which says exactly what the measure is.
The toolbar
The toolbar above the table is the same on every page like this one.
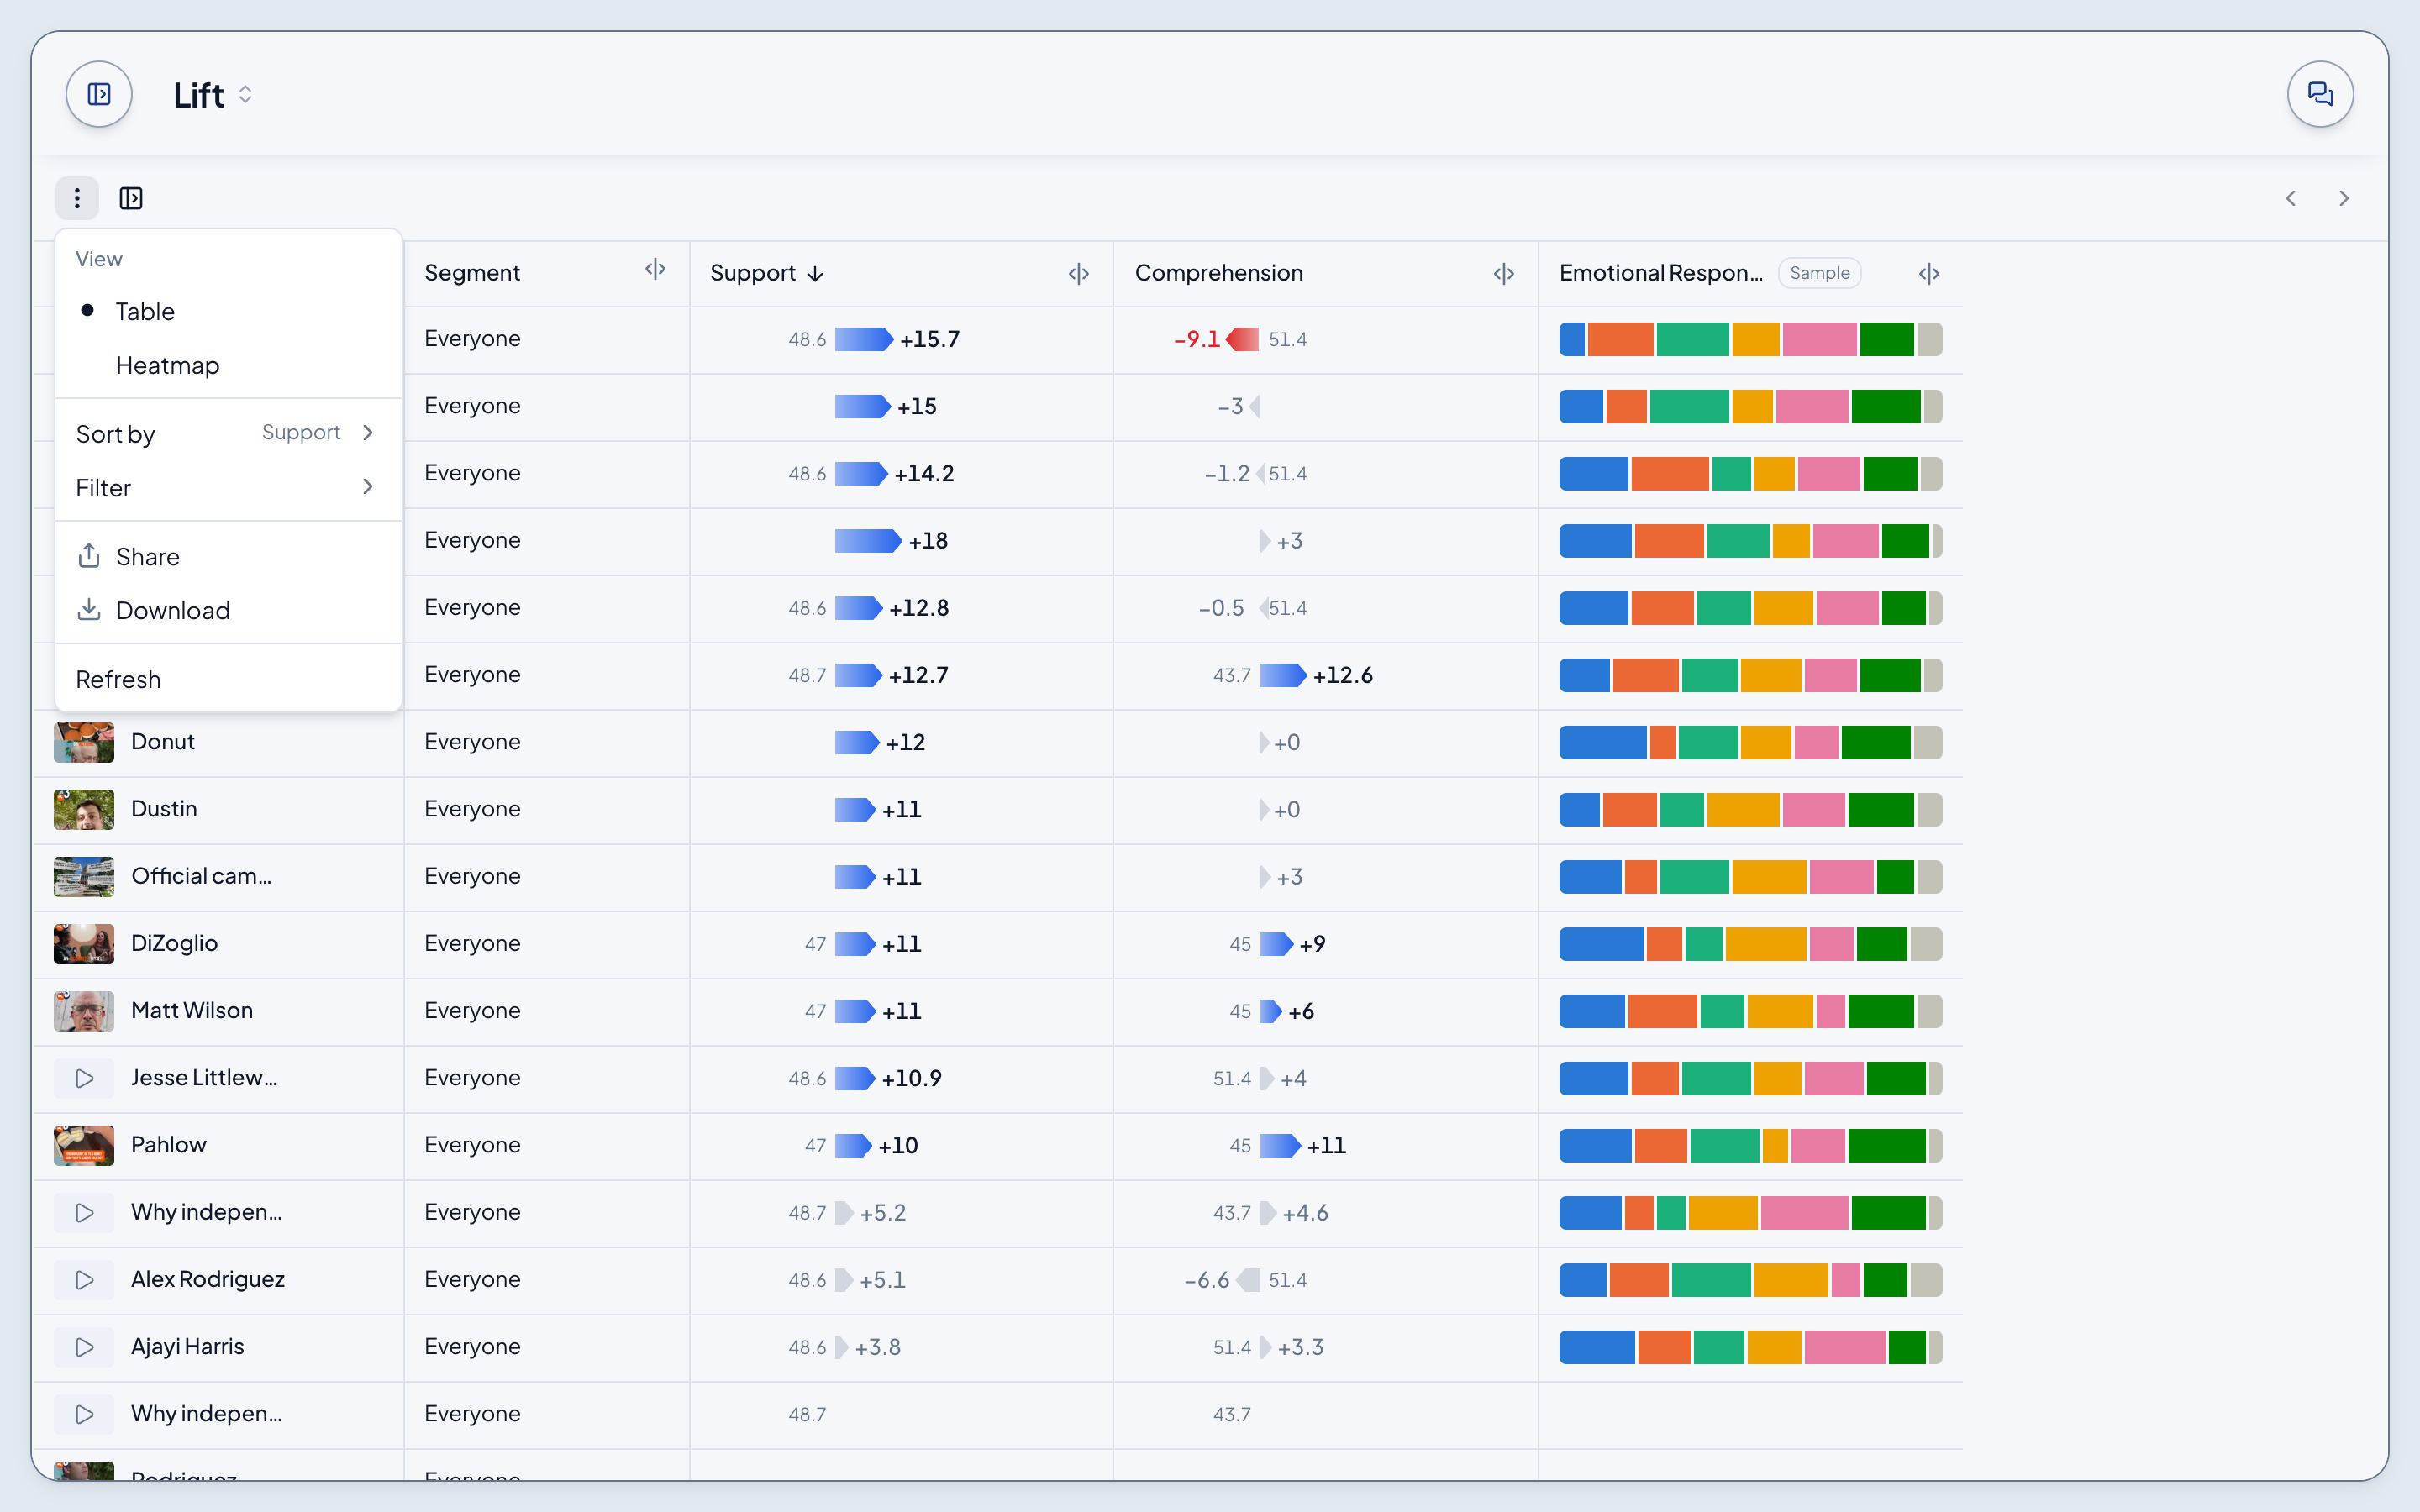
- ⋮ holds the rest: View (Table or Heatmap), Sort by, Filter, Share (copies a link to exactly what you're looking at), Download (a CSV of the table) and Refresh.
- The sidebar button opens Lift's sidebar: its search, folders, favorites, and what the table shows.
- Click the empty space to search treatments by name.
- ‹ › step the open Lift Analysis to the row before or after it.
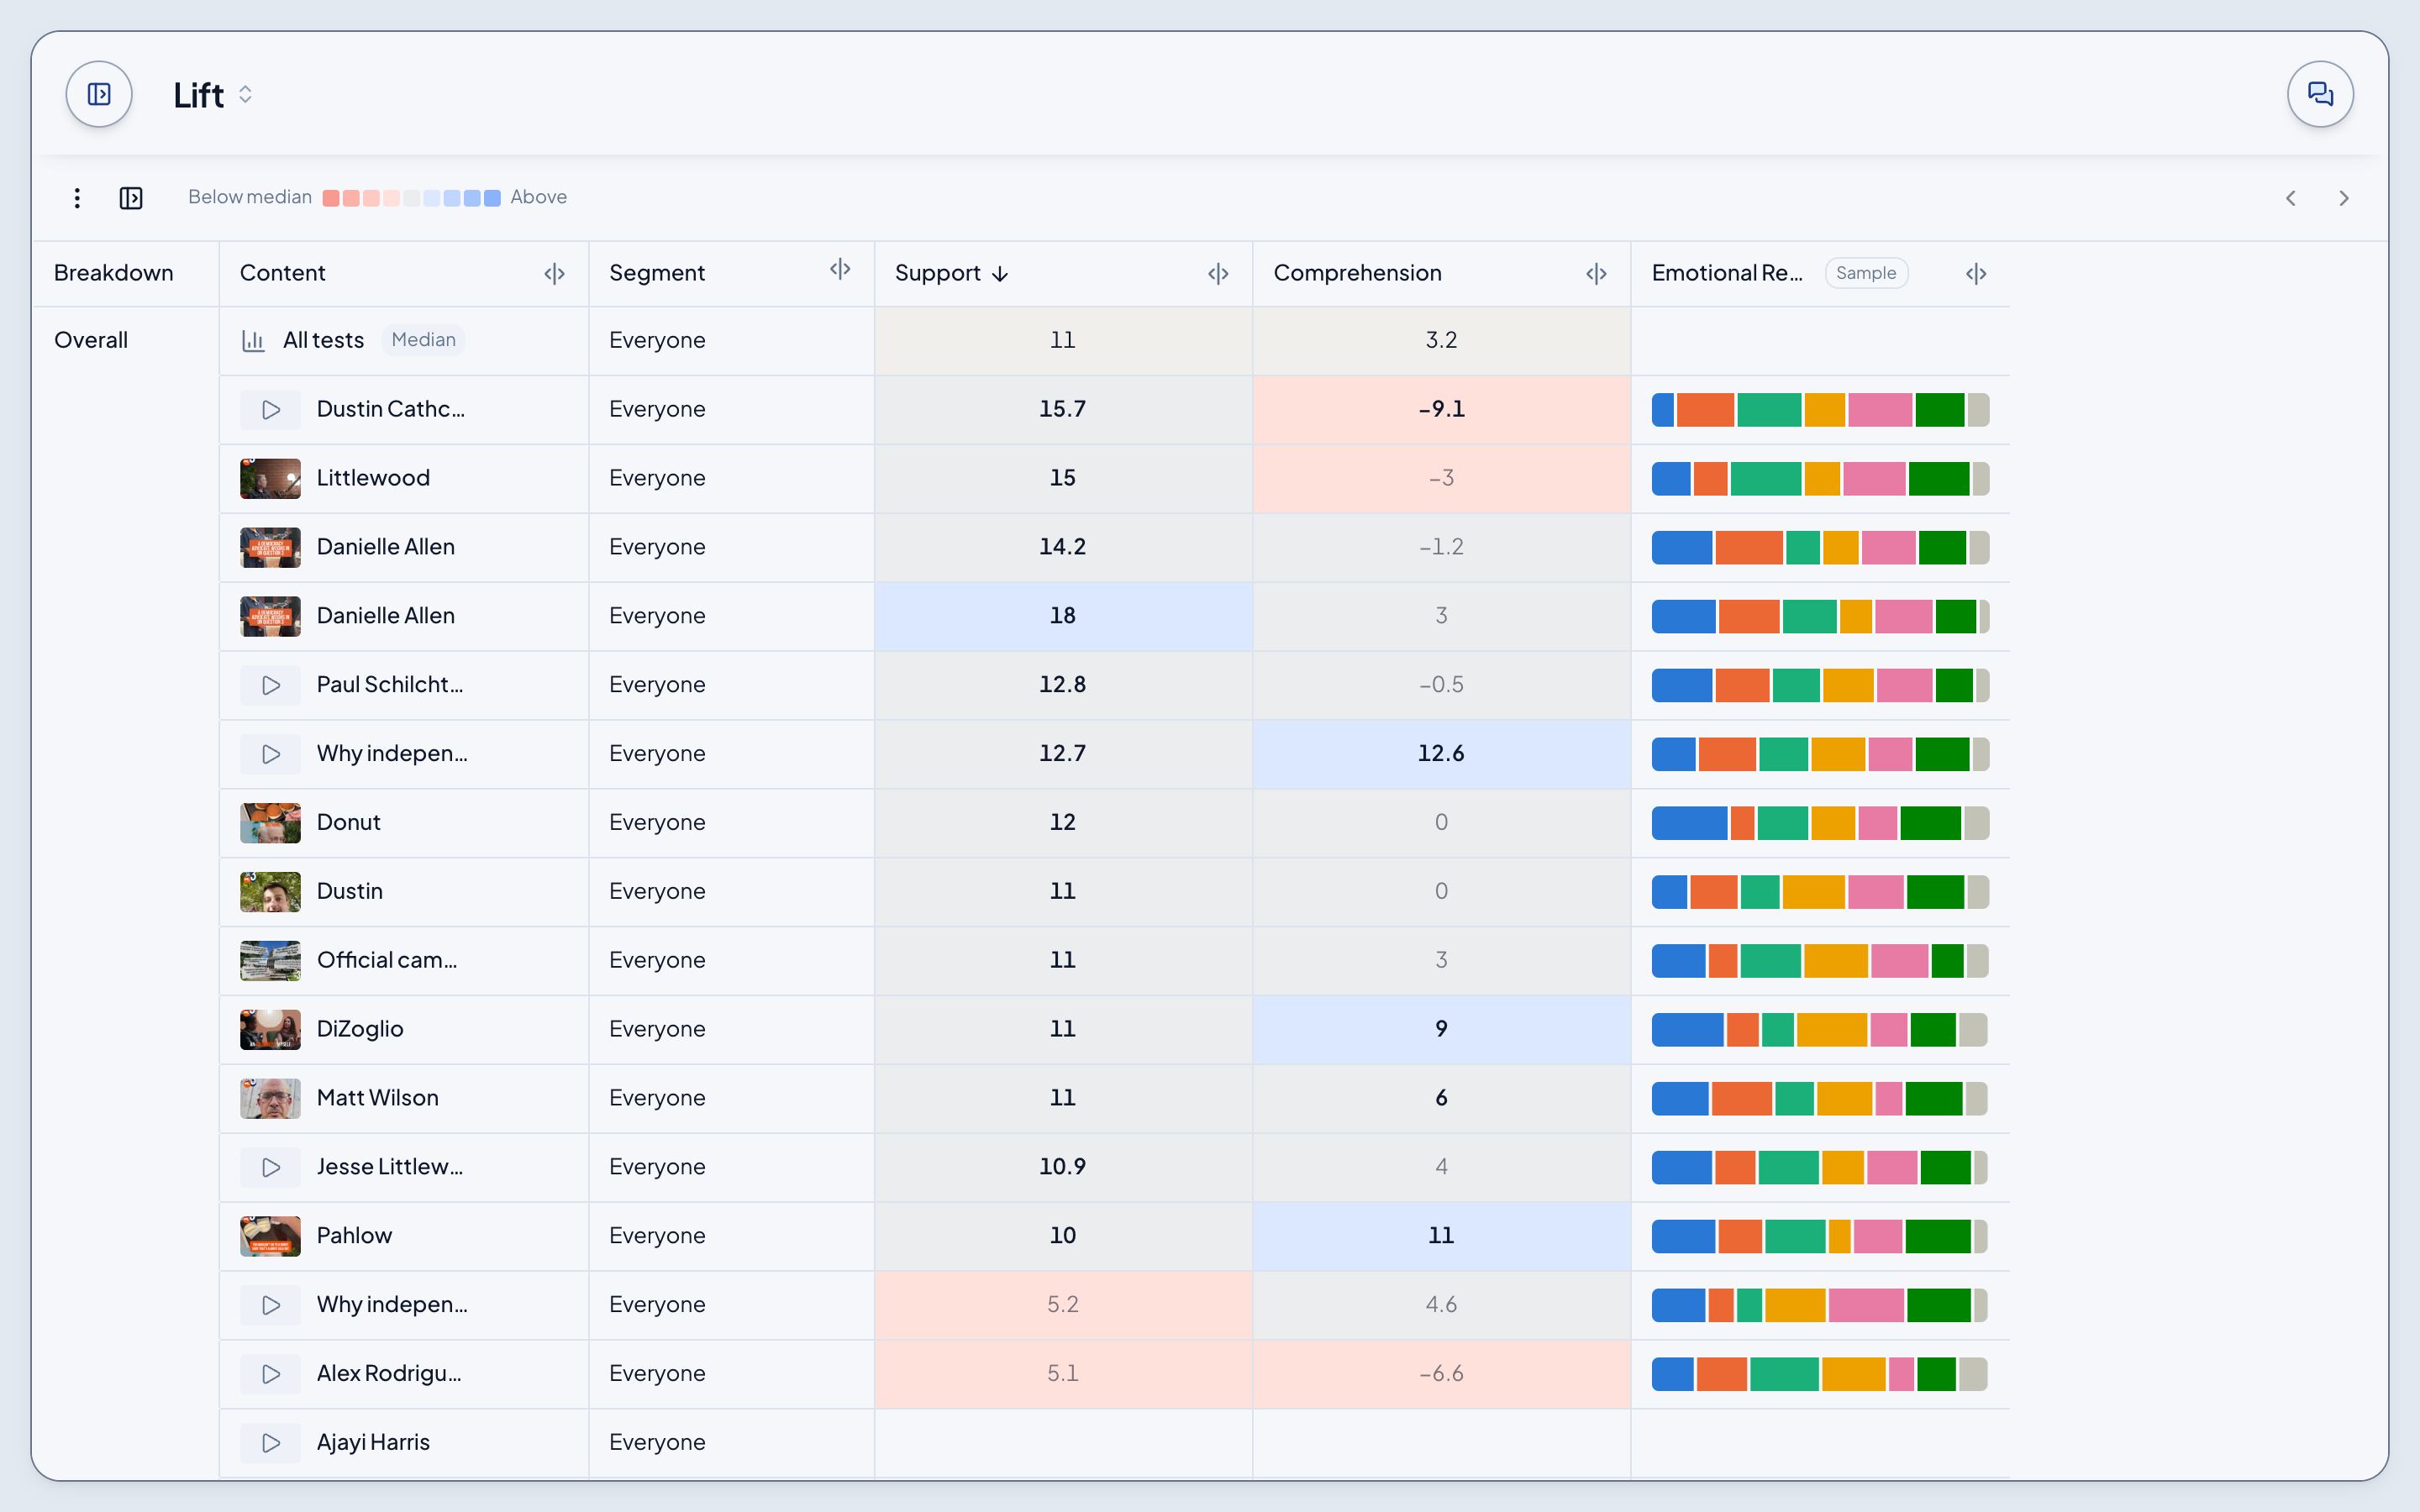
Heatmap
Choose View > Heatmap in the ⋮ menu to see every segment at once, each cell coloured by how far it sits from the benchmark. Benchmark in the same menu sets what the colours measure from: the median of all tests, or zero. The key on the toolbar reads the colours.
The two folders
- Tests: the message-test waves run here.
- Archive: 1,583 effects of 618 ads from campaigns' own randomized persuasion experiments (Hewitt, Broockman, Coppock et al., APSR 2024). See The Archive.